
Project management is an extensive field that requires several tools. Overseeing a project from its conception to completion puts a heavy burden on the project manager, who should always have proper documentation.
Among these is the project schedule diagram. To help you understand what this is, let us first define what the project schedule is. It is a timetable that captures and organizes all the project activities and their durations and the overall project milestones.
The project schedule network diagram is derived from the project schedule. In this article, we look at what this is, who uses it, how it is prepared, why one should use it, and its pros and cons. Let’s get started.
What is a Project Schedule Network Diagram?
The project schedule network diagram captures the order in which the project activities should be scheduled to address their logical relationships. It has different intersections, generally known as nodes, that symbolize the activities, whereas the arrows show the sequence and interdependencies of these activities.
This tool helps the project team picture all the activities that they should complete as the project progresses. It also establishes crucial information such as the task duration, sequencing, and dependency.
The project schedule network diagram is derived from the project schedule network, a graph showing all the given project’s activities, their duration, and interdependencies within the given assignment.
This tool helps team members clearly picture the sequential and logical relationships between a given project’s activities by establishing a defined sequence of tasks and events. Before we delve deeper into the benefits (which we will cover in a different section of the article), let us look at the different types of project network diagrams.
Types of Project Network Diagrams
There are only two types of project network diagrams in project management. These are the arrow diagramming method (ADM), also referred to as the activity network diagram or the activity on arrow, and the precedence diagramming method (PDM). The latter is also known as the node network or the activity on node.
Let’s explore these further.
Arrow Diagram Method (ADM)
In this diagram, an arrow is used to represent the activities in a given project. Due to its limitations, project managers no longer rely on it. However, we will still cover this to ease identification if it ever appears in the office or during your projects.
In this project schedule diagram, the arrow’s tail signifies the start of the given activity, the head its completion, and the length its duration. Each of the arrows in this diagram is connected to two boxes, popularly referred to as the nodes, which signify the start or end of a given activity in a sequence.
The starting node of an activity is referred to as the i-node, whereas the final node the j-node. Therefore, the ADM chart only represents the finish to start, or FS, a relationship between the nodes and activities.
What do we do with the dummy activities? Project managers are generally advised to include such arrows, even though they do not represent a direct relationship. This chart cannot include lead and lag times independently. One must introduce new nodes and activities.
Precedence Diagram Method (PDM)
This is the commonly used and universally accepted project schedule diagram. It more efficient compared to the ADM. In this chart, each of the boxes or nodes represents an activity, with the arrow establishing the relationships between these activities.
Unlike the first type, this diagram method captures all four relationships. These are the finish to start or FS, where one activity cannot start before another ends, start to finish(ss) where two activities cannot start at the same time, Finish to Finish (FF), where two tasks should finish together, and Start to Finish (SF) which is pretty uncommon. However, it occurs when one activity cannot end until another one starts.
This method removes all the limitations of ADM. One can add the lead and add times along the arrows. Therefore, if one activity requires five days to elapse until the next can occur, you can simply add ‘5 days’ over the arrow representing the relationship between the two nodes.
Why Do You Need a Project Schedule Network Diagram?
A project schedule diagram serves several purposes. It is mainly used to develop and keep a record of the sequences of activities. This tool is part of the project schedule management and is relied upon by other scheduling techniques such as the critical path method and the schedule network analysis.
You can also use the diagram to identify and discuss the sequences and dependencies in the activities. It also plays a vital role in stakeholder communication. However, note that this tool is more of a detailed and complex document that relates the sequences and the dependencies of all the project activities to its schedule and duration in bigger projects.
Therefore, other diagrams and means of presentation, such as the Gantt diagram, are favored over the project schedule diagram in such projects. Lastly, note that one can also use this diagram to record the leads and lags of a given activity. This also applies to activity floats and slacks. You will need the project schedule diagram to identify the activities that require the longest duration.
How to Create a Project Schedule Network Diagram
Now that you understand what a project schedule diagram is, its uses, and some of the types that you will be coming across in your work environment, it is time to help you come up with one. Remember, most of these project management tools are built from scratch, and therefore, you ought to understand all the steps.
Let’s delve deeper into these:
1. Define Activities
The first step in coming up with any project management tool that deals with project activities is to define these activities. We advise that you prepare the work breakdown structure, from where you will get the work package to help you build your activity list.
We believe that you already have the WBS since you must have defined high-level deliverables and work packages by now. Further break down the work packages into blocks that you can use for estimates and work schedules.
In simple terms, the project activities are obtained after breaking down the work package. While doing this, come up with an activity list and attributes. The former has the WBS ID linked to the activity, activity name, description, and the resources needed to work on an activity effectively.
The latter (activity attributes) has the work breakdown ID, activity name, description, predecessors, and the successors to a given activity. It also details the relationship of the predecessors and successor activities and the skills required for a given activity.
2. Estimate the Activity Durations
Our first step should help you come up with the list of activities and understand the work needed. This second step is all about coming up with their time estimates. There are three main estimation techniques that you can use when determining the duration of an activity. These are analogous, parametric, and 3 point.
The analogous estimation uses the actual information regarding past and previous efforts to determine the actions required in the current activities. In short, it uses past data to establish estimations for the current activities. For example, if a project team completed a past activity in ten hours, you can use that as a basis for estimating a similar activity.
On the other hand, parametric estimation picks a variable or unit within another project activity and uses it to estimate the current activity. For example, if you intend to create a thousand lines of code, but it took you one hour to build ten lines during your past project, this technique assumes that it will take you 100 hours.
The 3-point estimating technique considers the best, worst, and most realistic duration estimates of given activities before scaling them down into a formula and picking the most realistic estimate. The best formula to use if you would like to come up with a proper estimate is (Optimistic+ [4*Most Likely] + Pessimistic)/6.
Make sure that the estimation technique you pick gives you the most accurate estimates for your project.
3. Sequence the activities
This is the heaviest part of the project schedule network. Remember, all these former steps have been building up to sequencing. It is time to come up with a sequence now that you have estimated the activity durations.
Here, we will establish the activities’ predecessors and successors, the relationship between the activities, and how the sequence should look like. The first step before sequencing is to establish the dependencies. What activities are dependent on others?
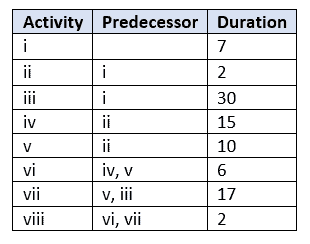
Make an entry in the activity attributes spreadsheet detailing the activity dependencies. You can then proceed and sequence your activities after clearly outlining the dependencies and understanding them. On the spreadsheet, you will create your project schedule network, build three columns in the upper left corner, and name them Activity, Predecessor, and Duration.
We advise that you start by listing the activities in a sensible order in the Activity column to help you work through them easily based on the information you have gathered. Once the activity list is up, add the predecessor and duration information of all the activities. Ensure that all the information entered does not conflict with the work order in the activity list.
At this juncture, you have everything you need to build the project schedule network diagram. The final step is to note interdependencies in the activities attribute document and outline the relationship between them.
An activity being a predecessor of the other establishes a relationship between them, which you should note. You then need to determine the type of relationship between these activities. We may have mentioned these at a given point in our article. However, here is a recap of the activities:
- Finish to Start– This is the commonest type of relationship between activities. One activity must end before another can begin.
- Start to Start – One activity must start before the other can begin.
- Finish to Finish – One activity must finish before a successor activity can finish.
- Start to Finish- Although rare, this relationship exists when one activity must start before another can end.
4. Create the diagram
The final step is to come up with the project schedule network diagram. Use all the information you have gathered to create a network diagram for the project. You can use Excel, Visio, or any other application that you deem fit.
You are advised to create a start box where you would like to begin your project before making boxes on the right side of the start box for the activities with no predecessors. Note the ID and duration for each of these activity boxes.
Do this for all the activities, and ensure that the final ones point to the end box. However, note that this is not the last step. Identify the activity paths throughout the network diagram before identifying the critical path. This is the longest path of activities, running from start to finish.
You can do this by writing out every possible path that runs from start to finish, then sum up their duration. The critical path is the one with the most prolonged duration and usually has no float. Once you have identified this, change the color of all the arrows leading to the critical path activities for easy visibility.
Here is a breakdown of everything we have covered in this part of the article to help you come up with the best project schedule diagram.
a) List of activities and their duration
b) Coming up with the critical path
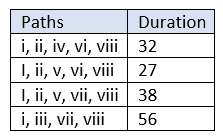
The critical path is i, iii, vii and viii which is the longest.
c) Project Schedule Network Diagram
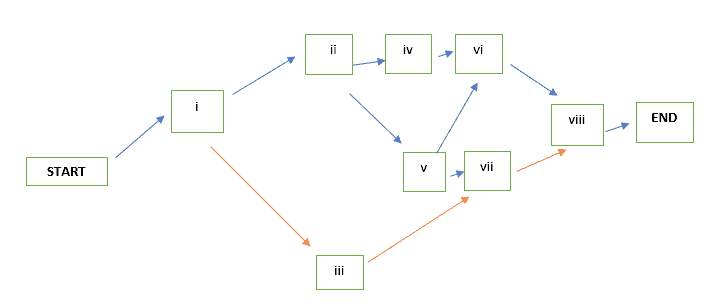
The orange arrows point at the critical parts.
Benefits of Using Project Schedule Network Diagram
- It identifies all the tasks that should be completed for project success.
- It identifies the critical activities and those with ‘float.’
- Helps in proper planning.
Disadvantages of Using Project Schedule Network Diagram
- It is time-consuming. Coming up with the project schedule network takes a lot of time.
- It may be costly to produce and could be misinterpreted as some are very complex.
- Errors can be costly, predominantly when entirely relied on.
Conclusion
The project schedule network plays a vital role in scheduling the activities in given projects, ensuring a smooth operation flow. This project management tool should be prepared in the planning stage of a project and used by the project manager to enhance efficiency.